Reducing operating expenses is no longer only an accounting exercise. For manufacturers, warehouses, retailers, and data centers, electricity bills can fluctuate like an unstable monthly rent. Solar energy offers a measurable path toward greater cost control, especially when systems match daytime demand. The real question is not whether panels look attractive, but how to reduce operational costs with solar energy without weakening reliability or cash flow.
The International Energy Agency reported in Renewables 2024 that solar photovoltaic capacity is expected to deliver most global renewable growth through 2030. Lazard’s Levelized Cost of Energy Analysis, Version 17.0, places unsubsidized utility-scale solar at approximately $29–$92 per megawatt-hour. These figures show strong cost potential, but they do not guarantee savings for every facility. Roof condition, local tariffs, storage needs, financing, maintenance, and interconnection delays can change the result. Small details matter. A shaded roof can quietly reduce annual output.
Fatih Birol, Executive Director of the IEA, has stated, “Solar is now the cheapest source of electricity in history.” His observation supports solar’s economic momentum, yet responsible planning requires more than a powerful headline. Businesses should compare interval electricity data, demand charges, available incentives, and realistic production forecasts. They should also test battery storage against actual peak-load patterns, not assumptions. Some projections will be wrong. That is normal, and it deserves review. A credible strategy combines engineering audits, transparent financial modeling, and performance monitoring after installation. This article explains practical ways to lower operating costs while protecting productivity, resilience, and long-term investment value.
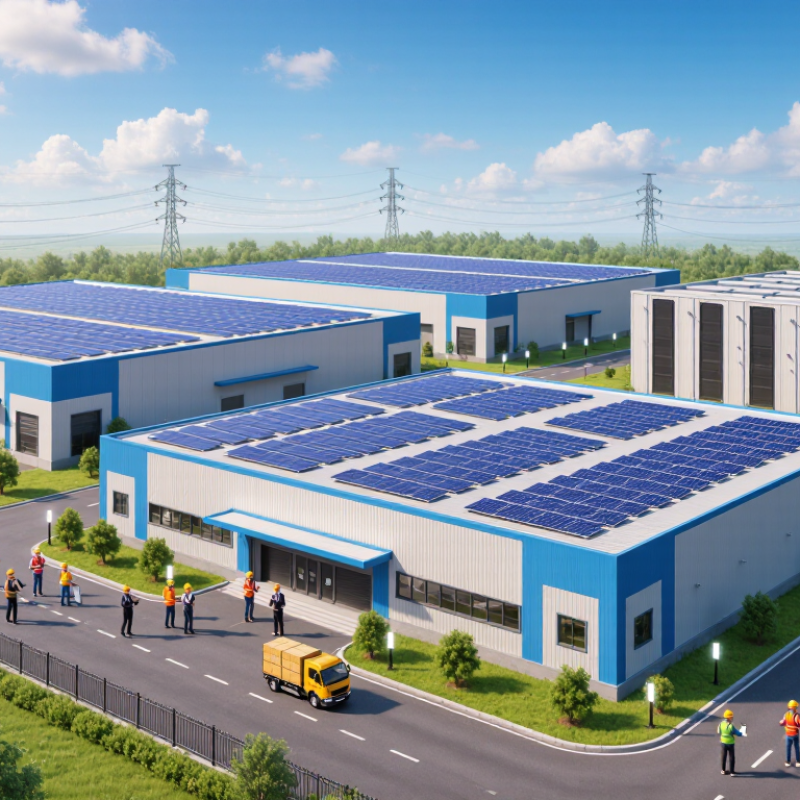
Solar energy can reduce operational costs in 2026 by replacing part of a facility’s daytime electricity purchases. Rooftop panels produce power when offices, warehouses, and production lines are active. This can lower monthly energy bills and reduce exposure to volatile grid prices. IRENA’s Renewable Power Generation Costs in 2023 reported a global weighted-average utility-scale solar cost of about $0.044 per kilowatt-hour. The report also recorded a 12% cost decline from 2022. These figures support solar’s improving economic position, although project costs vary by location, financing, and installation quality.
The practical savings depend on how electricity is used. A cold-storage site with steady daytime demand may use most solar power directly. That improves savings because less electricity travels back to the grid. Battery storage can shift surplus power into evening operations, but it adds capital, maintenance, and replacement costs. Demand charges also require careful monitoring. A system may generate plenty of energy yet fail to reduce the facility’s highest fifteen-minute demand.
Energy managers should compare twelve months of interval bills, roof conditions, maintenance records, and local tariffs before approving a project. IEA’s Renewables 2024 analysis expects renewable capacity to expand strongly through 2030, which may support more competitive equipment and financing. Still, forecasts are not guarantees. Shading, dust, weak controls, and underestimated repairs can erode returns. Solar reduces costs best when engineers measure performance monthly and adjust operations accordingly. Mistakes happen. Oversizing the system can be expensive.
Reducing operational costs with solar energy in 2026 starts with an honest energy assessment. Collect 12 to 24 months of utility bills, interval data, demand charges, and production schedules. Separate baseload demand from seasonal peaks. A warehouse may consume electricity overnight for refrigeration, while an office may peak at midday. These patterns determine whether rooftop solar can reduce purchases or only generate excess power.
Walk through the site with a simple checklist. Record roof age, shading, usable area, electrical capacity, and equipment locations. Use satellite measurements, then confirm them on site. The International Energy Agency reported that solar photovoltaic systems represented about three-quarters of global renewable capacity growth in 2023. However, strong growth does not guarantee a suitable project. Structural repairs, export limits, and weak winter production can change the economics quickly.
Model several scenarios, including solar-only, solar with batteries, and a no-build efficiency plan. The International Renewable Energy Agency reported that utility-scale solar’s global weighted average cost fell to about $0.044 per kilowatt-hour in 2023. Local tariffs still matter more than global averages. Compare projected generation with hourly load, not annual consumption alone. Our first estimate may be wrong. Clouds, curtailment, and maintenance are easy to underestimate. Review assumptions with an engineer and an accountant, then test the model against actual monthly bills.
This chart uses the U.S. Energy Information Administration’s 2023 monthly average commercial electricity prices. Higher electricity prices generally increase the value of on-site solar generation, especially when solar output aligns with daytime operational demand. Organizations should compare these price patterns with interval energy-use data, available roof or land area, and local solar resource before planning a 2026 project.
Reducing operational costs with solar energy in 2026 starts with system design, not panel quantity. The International Energy Agency reported approximately 420 gigawatts of new solar capacity in 2023. This growth has improved supply, but cheaper equipment does not guarantee lower costs. A factory should match system size with daytime demand, roof strength, grid limits, and seasonal production. Oversizing can create export losses or unnecessary capital costs. Small details matter.
The financing model changes the risk profile. Direct ownership offers long-term savings but requires significant upfront capital and maintenance planning. A power purchase agreement can reduce initial spending, while transferring performance risk to the provider. Leasing may simplify budgeting, yet it can limit future flexibility. Lazard’s 2024 Levelized Cost of Energy report placed utility-scale solar around 29 to 92 dollars per megawatt-hour, before site-specific factors. Local tariffs, taxes, interconnection fees, and insurance still require independent verification.
Technology should solve a measured problem. Battery storage can reduce demand charges when a facility faces sharp evening peaks. Smart energy management can shift refrigeration, pumping, or charging into solar hours. Bifacial modules may perform well on reflective surfaces, but field conditions decide the result. The National Renewable Energy Laboratory stresses that degradation, soiling, and inverter replacement affect lifetime economics. My early estimates often treated maintenance as a minor line item. That was too optimistic. Monthly monitoring, thermal inspections, and a clear performance guarantee provide stronger accountability. A realistic 2026 plan should model bad weather, lower production, and delayed grid approval—not only the best-case payback.
How to Reduce Operational Costs with Solar Energy in 2026?
Installation decisions shape operating costs for decades. A 1 MW rooftop system should begin with a structural survey, interval-load data, and a realistic shading model. Skipping these checks can create expensive redesigns. IRENA’s Renewable Power Generation Costs in 2023 reported utility-scale solar’s global weighted average cost at $0.044 per kWh, about 90% lower than in 2010. However, cheaper panels do not guarantee cheaper operations. Poor cable routing, difficult access, and weak monitoring can increase labor costs after commissioning.
Maintenance should be planned around measurable performance. Remote alerts can identify inverter faults, so technicians avoid unnecessary site visits. Keep spare fuses and connectors near the electrical room. Small details matter. The National Renewable Energy Laboratory’s 2024 Annual Technology Baseline shows fixed solar operating costs remain modest, but actual expenses depend heavily on cleaning, security, vegetation, and local labor. I would not assume one maintenance schedule fits every climate.
Storage requires a separate financial test. The BloombergNEF Energy Storage System Cost Survey 2024 placed average battery-pack prices at $115 per kWh, down 20% year over year. Yet battery degradation, thermal management, and replacement timing can erase expected savings. Use batteries for clearly priced demand peaks, not vague energy independence. Grid integration also needs export limits, protection studies, reactive-power controls, and transparent utility coordination. The International Energy Agency’s Electricity 2024 report emphasizes that flexible resources are increasingly important as solar penetration grows. Forecast errors remain. Build a modest contingency budget.
| Cost Area | Operational Metric | Indicative 2026 Planning Range | Cost-Reduction Opportunity | Recommended Management Action |
|---|---|---|---|---|
| Installation | Commercial rooftop solar capital cost | Approximately USD 0.90–1.80 per installed watt, excluding unusual structural upgrades | Lower balance-of-system and labor costs can reduce upfront capital expenditure | Use standardized designs, verify roof loading early, and obtain at least three comparable proposals |
| Installation | Annual solar electricity yield | Approximately 900–1,600 kWh per installed kW per year, depending on solar resource and system design | More onsite generation displaces purchased electricity | Prioritize unshaded roof areas and size the system against daytime load rather than roof area alone |
| Installation | Solar project development timeline | Approximately 4–12 months from feasibility assessment to commissioning for a typical commercial project | Shorter deployment reduces financing, temporary power, and project-management costs | Start permitting, structural review, and utility screening before final equipment procurement |
| Maintenance | Routine solar operations and maintenance | Approximately 1%–2% of initial solar capital cost per year | Preventive maintenance limits downtime and lost generation | Use remote monitoring, scheduled inspections, vegetation control, and condition-based repairs |
| Maintenance | Module performance degradation | Common planning assumption: approximately 0.3%–0.8% reduction in output per year | Accurate degradation forecasting improves long-term energy budgeting | Track monthly specific yield in kWh/kW and investigate deviations from the expected trend |
| Maintenance | Inverter service and replacement planning | Major inverter replacement commonly planned around years 10–15; actual life depends on operating conditions | Planned replacement avoids emergency labor and extended production losses | Maintain a replacement reserve and keep critical spare components available |
| Energy Storage | Commercial battery storage investment | Approximately USD 300–600 per usable kWh installed, depending on duration, site works, controls, and market | Storage can reduce peak-demand charges and increase onsite solar consumption | Model battery savings using interval load data and tariff demand windows before purchase |
| Energy Storage | Battery round-trip efficiency | Approximately 85%–95% for a complete charge-and-discharge cycle | Higher efficiency increases the usable value of stored solar electricity | Compare usable energy, not only nameplate capacity, and include auxiliary consumption in financial models |
| Energy Storage | Typical commercial storage duration | Approximately 2–4 hours for peak shaving and solar shifting applications | Appropriate duration prevents overinvestment in unused capacity | Size the system around the duration of the site’s peak-demand period and solar surplus |
| Energy Storage | Battery usable-capacity management | Maintain operating limits according to the battery warranty; a planning range of 80%–90% usable state-of-charge window is common | Avoiding excessive cycling can extend battery service life | Use energy-management controls that balance demand savings, backup needs, and battery degradation |
| Grid Integration | Utility interconnection timeline | Approximately 3–12 months for commercial projects; network upgrades may extend the schedule | Early approval reduces redesign, standby financing, and construction delays | Perform a preliminary utility review and confirm export limits before final system sizing |
| Grid Integration | Onsite solar self-consumption | Often approximately 50%–90% without storage, depending on the load profile and system size | Self-consumed solar generally avoids retail electricity purchases more effectively than exported energy | Shift flexible loads, such as pumping, refrigeration, and charging, into high-generation periods |
| Grid Integration | Peak-demand reduction through solar and storage | Approximately 10%–30% reduction may be achievable at suitable sites; results depend on tariff structure and load shape | Lower monthly demand charges can materially improve project economics | Use 15-minute or 30-minute interval data to verify demand-charge savings rather than estimating from monthly totals |
| Grid Integration | Export limitation and curtailment risk | Highly site-specific; export restrictions can require controls, storage, or a smaller PV system | Reducing unnecessary export avoids lost generation value and interconnection upgrades | Install approved power-control systems and simulate worst-case export conditions before commissioning |
| Financial Control | Simple payback period | Often approximately 5–12 years for commercial solar; storage may lengthen or shorten payback depending on tariff savings | A project can reduce operating expenditure after the capital recovery period | Calculate payback using local electricity prices, demand charges, financing costs, degradation, maintenance, and export revenue |
Planning note: The figures are indicative 2026 planning ranges for commercial and industrial projects in USD. Actual costs and savings vary by country, labor rates, permitting requirements, roof condition, electricity tariffs, climate, utility rules, financing structure, and system design.
How to Reduce Operational Costs with Solar Energy in 2026?
Solar energy can reduce operating costs, but savings depend on measured performance. IRENA reported a global weighted-average utility-scale solar cost of $0.044 per kilowatt-hour in 2023. This figure was 56% below the weighted average cost of fossil-fuel generation. For a facility using 1,000 megawatt-hours annually, even partial solar coverage can reduce exposure to volatile electricity prices. However, the result depends on tariff structure, self-consumption, financing, and grid charges.
Performance losses need continuous attention. NREL research places typical photovoltaic degradation near 0.5% annually. After ten years, a system may produce roughly 5% less energy. Dust, shading, inverter faults, and extreme heat can reduce output faster. The weak point? Maintenance assumptions. A low-cost plan may ignore inspection labor, replacement parts, insurance, and battery degradation. Those costs can quietly change the payback period.
Operational teams should track energy yield, availability, response time, and maintenance cost per kilowatt. Monthly meter data helps compare actual production with weather-adjusted expectations. A five-minute outage is not equal to a five-day inverter failure. Site records should capture both. The International Energy Agency also identifies grid integration and flexibility as growing priorities as solar deployment expands. Storage may improve resilience, but it adds capital, thermal-management needs, and replacement risk. A spreadsheet can still lie. Conservative forecasts should test lower production, higher interest rates, and delayed repairs before approving a 2026 project.
Gather 12 to 24 months of utility bills, interval data, demand charges, and production schedules. Note when refrigeration, pumps, or office equipment run. Compare hourly demand with expected sunlight.
Record roof age, shading, usable area, electrical capacity, and equipment locations. Confirm measurements on site; satellite images can miss obstructions. Structural repairs can change project economics.
Match expected generation to daytime load, roof strength, grid limits, and seasonal output. A larger array is not always better. Excess generation may earn little or face export limits.
Direct ownership needs more upfront capital but may offer long-term savings. A power purchase agreement or lease can reduce initial spending, though risks and flexibility differ. Check local fees, taxes, and insurance.
Test batteries against specific, priced demand peaks, such as a sharp evening load. Include degradation, cooling, and replacement costs. Energy independence alone is too vague.
Budget for cleaning, inspections, monitoring, and local labor. Remote alerts can flag inverter faults before a site visit. Keep spare fuses and connectors near the electrical room. I once treated maintenance as minor. That was too optimistic.
Check export limits, interconnection requirements, protection settings, and utility approval timelines. Forecast errors happen. Set aside a modest contingency budget for redesigns or delays.
Compare solar-only, solar-plus-battery, and efficiency-only scenarios against monthly bills. Include cloudy periods, curtailment, lower production, and maintenance. Clouds matter. Global cost averages are only a starting point; local tariffs matter more.
In 2026, organizations can explore how to reduce operational costs with solar energy by replacing part of their conventional electricity use with self-generated power. The process begins with reviewing historical energy consumption, peak demand, facility schedules, available roof or land area, and local sunlight conditions. This assessment helps determine the appropriate system size and expected savings while identifying opportunities to improve efficiency before installation.
A practical solar strategy should also compare ownership, leasing, and other financing models, along with suitable panels, inverters, monitoring tools, and battery storage. Careful planning is essential for permitting, installation, maintenance, safety, and grid connection. Over time, organizations should track energy production, utility reductions, maintenance expenses, system performance, and payback progress. Regular reviews can reveal operational risks, support timely equipment upgrades, and help ensure that solar investments continue delivering predictable long-term savings.

3UP Energy