Evaluating a solar project requires more than checking its electricity bill. The central question is how to evaluate the performance of a solar energy project accurately, consistently, and fairly. A reliable assessment connects design expectations with real operating evidence. It examines energy yield, performance ratio, system availability, degradation, and financial results.
Begin with measured data. Compare monthly production with satellite irradiance, on-site weather readings, and the original energy model. Inspect inverter logs, meter records, equipment alarms, and maintenance reports. A dusty module may look harmless, yet soiling can reduce output across an entire array. Shading from new vegetation can create a similar problem. Small details matter.
Performance is not only about kilowatt-hours. Review whether the plant operates safely and consistently during cloudy periods, high temperatures, and grid interruptions. Check response times, replacement records, warranty coverage, and the quality of preventive maintenance. Independent engineers can validate assumptions and identify measurement errors. Still, no single metric tells the whole story.
A project may achieve strong annual production while underperforming during expensive peak hours. Another may meet its forecast but show abnormal inverter losses. These findings deserve careful interpretation. Weather changes, sensor drift, curtailment, and incomplete records can distort conclusions. That is why transparent methods and traceable evidence are essential. A balanced evaluation should explain both strengths and weaknesses, helping owners improve operations, protect investment value, and make decisions based on reliable performance rather than optimistic estimates.
Project Objectives and Key Performance Indicators
A solar project should begin with measurable objectives, not optimistic production estimates. Define the target annual energy yield, revenue, emissions reduction, and operational availability. Each objective needs a baseline, owner, deadline, and acceptable variance. A 100 MW plant, for example, may target 165 GWh annually, but local irradiation and grid limits must shape that figure.
Track performance ratio, specific yield, capacity factor, availability, curtailment, and degradation. These indicators reveal different problems. A falling performance ratio may signal soiling, inverter faults, or shading. NREL’s photovoltaic degradation research reports a median decline near 0.5% per year. Use that figure cautiously. Site conditions can produce different results. IRENA’s Renewable Power Generation Costs report recorded global utility-scale solar costs near USD 0.044 per kWh in 2023. Financial models should test whether actual operating costs support that benchmark. The IEA PVPS Trends report also shows rapid global deployment, making reliable asset performance increasingly important.
Tips: Set KPIs at five-minute and monthly levels. Inspect one underperforming inverter physically. Compare measured irradiation with satellite data. Separate grid curtailment from equipment downtime. Review forecast error after unusual weather. A dashboard can look impressive while hiding weak data quality. That happens. Also, do not treat availability as energy yield; a plant may be available but poorly positioned, dirty, or regularly curtailed. Revisit targets after the first operating year, because early assumptions are rarely perfect.
How to Evaluate the Performance of a Solar Energy Project? - Project Objectives and Key Performance Indicators
| Performance Dimension |
Project Objective |
Key Performance Indicator |
Calculation / Unit |
Target |
Measured Result |
Status |
Review Period |
| Project Capacity |
Install the planned generation capacity |
Installed AC capacity |
Rated inverter capacity |
50.0 MW |
50.0 MW |
Achieved |
Commercial operation date |
| Energy Yield |
Maximize annual electricity production |
Net energy generated |
Metered export to grid |
92,000 MWh |
94,600 MWh |
Above Target |
Calendar year 2025 |
| Specific Yield |
Assess output relative to installed capacity |
Specific energy yield |
Annual generation ÷ installed kWp |
≥1,840 kWh/kWp |
1,892 kWh/kWp |
Above Target |
Calendar year 2025 |
| Performance Ratio |
Minimize losses from temperature, wiring, soiling, and equipment |
Performance ratio |
Actual yield ÷ reference yield × 100 |
≥82.0% |
84.2% |
Above Target |
Calendar year 2025 |
| System Availability |
Keep the plant operational and grid-ready |
Technical availability |
Available hours ÷ total scheduled hours × 100 |
≥98.0% |
99.1% |
Above Target |
Calendar year 2025 |
| Curtailment |
Reduce energy losses caused by grid limitations |
Curtailed energy percentage |
Curtailed energy ÷ potential energy × 100 |
≤2.0% |
1.6% |
Within Limit |
Calendar year 2025 |
| Degradation |
Preserve long-term generation capability |
Annual output degradation |
Year-over-year normalized yield reduction |
≤0.50%/year |
0.38%/year |
Within Limit |
Year 2 versus Year 1 |
| Forecast Accuracy |
Improve production planning and power-market scheduling |
Day-ahead forecast accuracy |
1 − absolute forecast error |
≥95.0% |
97.4% |
Above Target |
Quarter 4, 2025 |
| Operations and Maintenance |
Resolve faults quickly and limit lost production |
Mean time to respond |
Average time from alarm to technician response |
≤4.0 hours |
2.3 hours |
Within Limit |
Calendar year 2025 |
| Safety |
Maintain a zero-harm operating environment |
Total recordable incident rate |
Recordable cases × 200,000 ÷ labor hours |
0.00 |
0.00 |
Achieved |
Calendar year 2025 |
| Financial Performance |
Produce electricity at a competitive lifetime cost |
Levelized cost of energy |
Lifetime discounted costs ÷ lifetime generation |
≤$45.00/MWh |
$41.80/MWh |
Within Limit |
Financial model update |
| Environmental Impact |
Reduce emissions through renewable electricity generation |
Estimated avoided carbon dioxide emissions |
Net generation × 0.45 tCO₂e/MWh |
≥41,400 tCO₂e |
42,570 tCO₂e |
Above Target |
Calendar year 2025 |
Overall Assessment: The project meets or exceeds all defined operational, financial, safety, and environmental objectives.
Core Data Sources: Revenue-grade meters, SCADA records, irradiance sensors, maintenance logs, safety records, and the financial model.
Solar Resource Assessment and System Design Review
Evaluating a solar energy project starts with a defensible solar resource assessment. I review measured irradiance, historical weather records, terrain, and seasonal patterns before trusting a yield forecast. A short onsite campaign can reveal local haze, dust, or shading that satellite data misses. Pyranometers need correct leveling, clean surfaces, and regular calibration checks. I compare readings against nearby stations and investigate unusual gaps instead of quietly filling them. No dataset is perfect. That limitation should appear clearly in the report. Uncertainty ranges matter because annual energy estimates influence financing, maintenance planning, and grid expectations.
The system design review should connect those measurements to actual equipment and operating conditions. I check array orientation, tilt, row spacing, inverter capacity, cable losses, and temperature effects. A credible model includes soiling, availability, degradation, clipping, and auxiliary consumption. Shading analysis deserves close attention, especially near trees, ridges, buildings, or future construction. I test optimistic and conservative assumptions, then compare both with the proposed performance ratio. Field experience often exposes design details models overlook, such as difficult access or recurring morning shadows. Real weather is untidy. A strong review records each assumption, identifies weak evidence, and leaves clear questions for the next engineering decision.
Energy Yield Measurement and Performance Ratio Analysis
How to Evaluate the Performance of a Solar Energy Project?
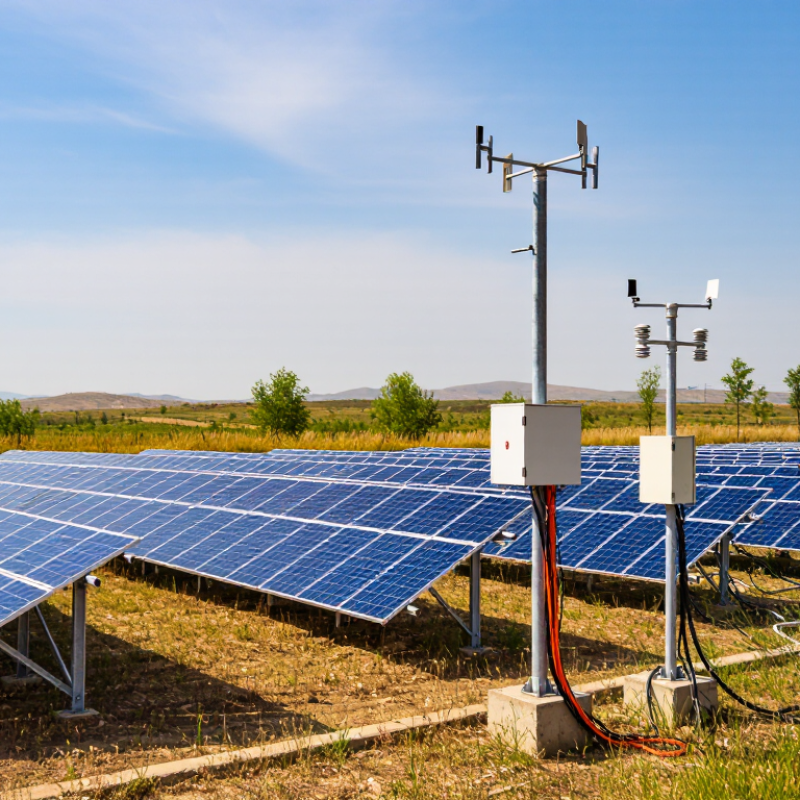
Energy yield measurement shows how much electricity a solar plant actually produces. Record exported energy at the revenue meter, preferably in 5- or 15-minute intervals. Match these readings with plane-of-array irradiance, module temperature, ambient temperature, and system availability. A cloudy afternoon can reveal more than a monthly average.
Performance ratio (PR) compares actual production with the energy theoretically available from sunlight. The common formula is PR = Yf / Yr. Yf is the final yield, measured in kilowatt-hours per installed kilowatt. Yr is the reference yield, calculated from plane-of-array irradiance. A falling PR may indicate soiling, shading, inverter losses, clipping, or thermal stress. It may also expose a faulty irradiance sensor.
Measure carefully.
Field checks matter. Inspect sensor alignment, clean representative modules, and compare meter data with inverter records. Keep timestamps synchronized; a ten-minute clock error can distort short-term analysis. Account for planned outages and grid restrictions, but do not hide them inside a correction factor. That weakens trust.
Real projects rarely produce perfect datasets. Sensors drift. Communication fails. Some losses remain uncertain. I would flag missing intervals instead of replacing them with convenient averages. Compare PR across seasons, weather conditions, and equipment groups. A single high PR does not prove excellent performance, especially after unusually cool, bright weather. Independent review, documented assumptions, and repeatable calculations make the assessment more credible.
Operational Reliability, Maintenance, and Degradation Assessment
How to Evaluate the Performance of a Solar Energy Project?
Operational Reliability, Maintenance, and Degradation Assessment
A solar project should be judged by stable performance, not peak production alone. Track availability, performance ratio, and energy yield against measured irradiance. A reliable monitoring system records inverter trips, grid interruptions, sensor errors, and recurring alarms. Small failures matter. A ten-minute outage can reveal a larger control or cooling problem. Compare daily data with weather conditions, because cloudy mornings can distort simple production targets.
Maintenance records should connect each fault to its response time and energy loss. Inspect modules for cracks, hotspots, loose connectors, and heavy soiling. Thermal imaging can expose abnormal temperatures before visible damage appears. Technicians should also check cable insulation, drainage, tracker movement, and ventilation. Preventive work must follow site risks, not a generic calendar. In practice, teams sometimes clean panels too often while missing poorly tightened electrical connections. That is an expensive lesson.
Degradation requires clean, long-term evidence. Compare normalized output across seasons, using calibrated irradiance and temperature data. A gradual decline may result from module aging, soiling, shading, sensor drift, or repeated inverter clipping. Separate these causes before calculating an annual degradation rate. Many assessments use a range near 0.3% to 0.8% per year, but site conditions can shift it significantly. A neat dashboard can still hide weak assumptions. Keep uncertainty visible, review missing data, and revise the model when field measurements disagree.
Financial, Environmental, and Long-Term Project Evaluation
How to Evaluate the Performance of a Solar Energy Project?
Financial, Environmental, and Long-Term Project Evaluation
A solar project should be judged by more than its installed capacity. In practice, I compare actual energy output with the original forecast each month. Key indicators include capacity factor, performance ratio, system availability, and annual degradation. Revenue assumptions need equal attention. I test power prices, operating costs, interest rates, and delayed construction schedules. Net present value, internal rate of return, and levelized cost of electricity reveal different risks. One attractive forecast can still hide weak cash flow.
Environmental performance requires measured evidence, not broad claims. I review lifecycle emissions from manufacturing, transport, construction, operation, and disposal. Land disturbance also matters, especially near farmland, wetlands, or sensitive habitats. Water use may be limited during operation, but panel cleaning can affect local demand. A credible assessment records habitat changes, waste handling, and recycling plans. Local consultation should be documented, including concerns that the developer could not fully resolve.
Long-term evaluation depends on maintenance quality and transparent monitoring. Inspecting inverter faults, dust buildup, cable damage, and vegetation growth can explain sudden output losses. Data should be checked against irradiance measurements and weather records. Small errors matter.
I also run sensitivity scenarios for cloudy years, component replacement, grid curtailment, and lower-than-expected degradation. These scenarios are uncomfortable, yet useful. Some projects perform well financially but create avoidable land pressure. Others deliver strong environmental benefits while missing production targets. A reliable evaluation keeps both findings visible.
Conclusion
Evaluating a solar energy project requires a structured review of its technical, operational, financial, and environmental results. The process begins by clarifying project objectives and defining key performance indicators, such as energy production, system availability, performance ratio, cost efficiency, and emissions reduction. A careful assessment of solar resources and system design helps confirm whether the equipment, layout, and expected conditions are appropriate for the site. Actual energy yield should then be compared with forecasts, while performance ratio analysis can reveal losses caused by shading, temperature, equipment limitations, or grid interruptions.
To understand how to evaluate the performance of a solar energy project over time, it is also important to examine operational reliability, maintenance quality, downtime, and equipment degradation. The final evaluation should consider investment returns, operating costs, environmental benefits, risks, and long-term energy output. Combining these findings provides a balanced view of project effectiveness and supports informed decisions about optimization, future investment, and sustainable operation.
 3UP Energy